Blog repurposing
Turn a published article into a visual summary for social, newsletters, presentations, or an embedded companion asset.
Independent tool overview
Infography is an AI infographic generator that turns a blog URL, article, topic, or pasted text into a visual draft. It adds reusable brand colors, fonts, logos, templates, support for more than 100 languages, and a beta API with Make.com automation. It is useful for repurposing vetted content quickly, but it should not be trusted to preserve statistics, citations, labels, chronology, or nuance without a line-by-line editorial and visual review.
Visit the official Infography site ↗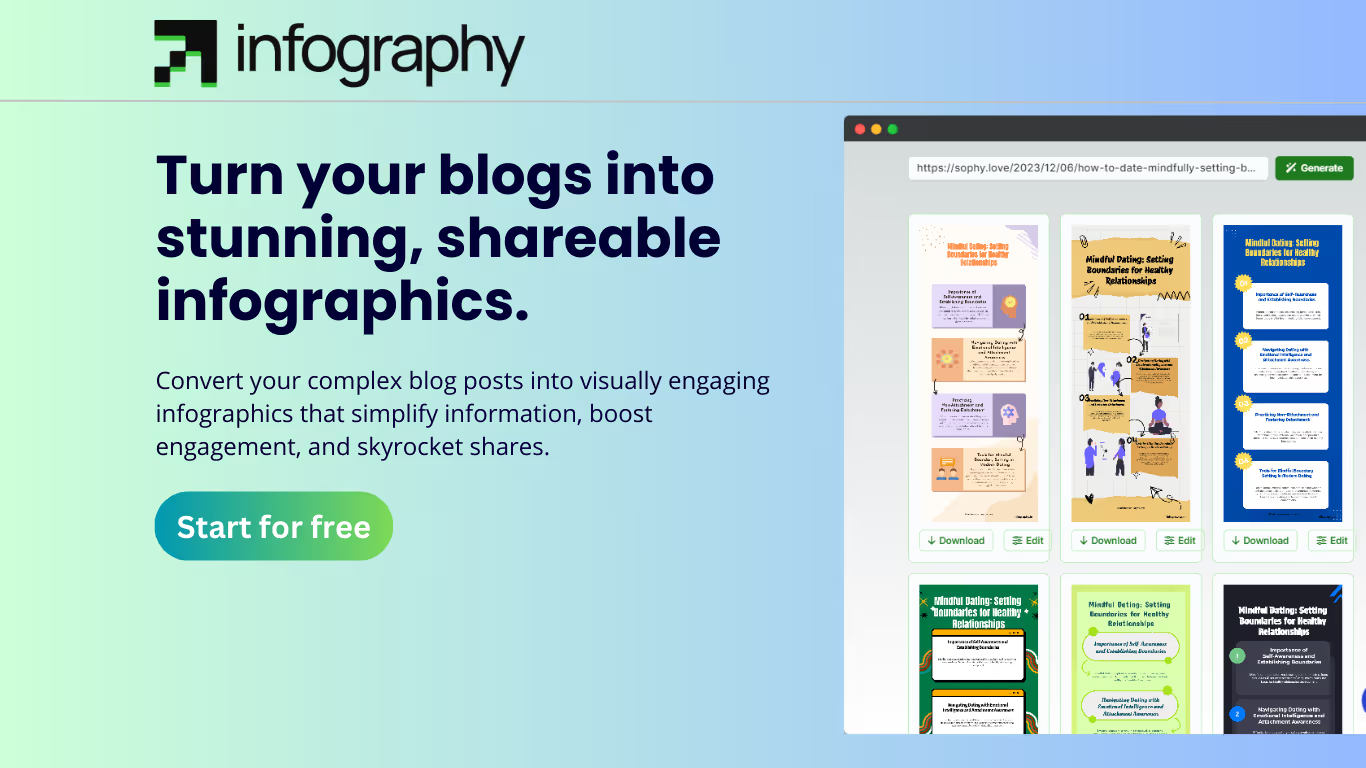
Overview
Infography is designed around content repurposing rather than an open-ended design canvas. A user supplies an existing blog post, article, topic, or body of text, and the service analyzes that material, selects a visual structure, and produces an infographic draft.
The product adds brand profiles for colors, fonts, and logos, plus templates intended for blog summaries, data visualization, product explanations, and other repeatable layouts. The current pricing page advertises 50 monthly AI credits on Lite and 250 on Pro, with Pro allowing up to five users.
Developers can use a beta REST API and a documented Make.com integration to trigger infographic generation from new content and route outputs into social workflows. Infography says each API request consumes one credit and warns that endpoints may change while the API is under active development.
Infography's own marketing claims speed and accuracy, but those claims are not independent evidence. An infographic compresses source material, so a misplaced decimal, simplified caveat, invented icon, bad chart scale, or unattributed quotation can become more persuasive than the original error. Every factual element needs to be checked against the source before publication.
The public legal documents are unusually brief and appear partly out of sync with the current Lite/Pro offer. They name MongoDB, Vercel, and Google's Gemini 2.5 Flash Lite, grant Infography a license to use input content to provide and improve the service, and say team administrators may see member content. Organizations should clarify retention, subprocessors, training use, security, deletion, account roles, and automation terms before uploading confidential or client material.
Use cases
The strongest fit depends on the job you need the product to complete, not the size of its feature list.
Turn a published article into a visual summary for social, newsletters, presentations, or an embedded companion asset.
Create a first-pass timeline, process, comparison, or concept summary from instructor-approved material.
Apply saved colors, fonts, and a logo to recurring infographic templates for a more consistent visual system.
Generate localized visual concepts across advertised languages, followed by native-speaker and layout review.
Use the beta API or Make.com to draft graphics from new posts when a human approval gate remains before publishing.
Capabilities
Converts a blog post, article, or pasted text into a structured visual draft.
Can start from a topic or short content brief when the user does not have an existing blog post.
Stores colors, fonts, and logos so they can be applied across templates and recurring assets.
Provides layouts with designated color, chart, header, accent, and logo areas for repeatable production.
Paid tiers advertise support for more than 100 languages.
The current Pro offer advertises adding up to five users, while administrators may have access to member-created content.
Accepts authenticated generation requests and charges one credit per request according to the current API overview.
Supports no-code workflows that can trigger generation from new blog content and pass assets toward social publishing steps.
Infography's terms say generated infographics belong to the user and may be used commercially, while underlying software remains Infography's property.
Process
Step 1
Start from the final approved article, dataset, lesson, or brief—not an early draft, search snippet, or uncited AI summary.
Step 2
Specify the audience, channel, intended takeaway, reading level, aspect ratio, and whether the visual is a timeline, process, comparison, list, or data story.
Step 3
List every number, date, quotation, named entity, and causal claim with its primary source and freshness date before generation.
Step 4
Remove personal data, confidential material, paywalled text without permission, client assets outside contract scope, and inputs that cannot be sent to third-party processors.
Step 5
Use the URL, text, or topic to create a draft, then check whether the hierarchy and chosen visual form match the actual argument.
Step 6
Load approved colors, type, and logo; verify contrast, logo clear space, minimum type size, and whether the template still works after localization.
Step 7
Compare each label, statistic, unit, date, sequence, quotation, legend, icon, and chart scale with the source ledger. Remove any unsupported element.
Step 8
Look for truncated copy, invented relationships, distorted proportions, decorative charts that imply false magnitude, low contrast, and an inaccessible reading order.
Step 9
Clear source text, imagery, logos, fonts, trademarks, and likenesses; add citations and AI or sponsored-content disclosures where the context requires them.
Step 10
Have the responsible editor or subject-matter owner approve the final asset before download, posting, embedding, or API distribution.
Step 11
For API or Make.com use, validate authentication, rate and credit failures, retries, duplicates, version changes, moderation, logging, and a kill switch that stops auto-publishing.
Step 12
Save the source version, prompt or request, generation date, model or product version, final export, approvals, and citations so later corrections are possible.
Cost
Infography's live homepage currently renders promotional monthly prices of $9 for Lite and $18 for Pro, plus annual totals of $90 and $180. It also contains stale offer language with a December 2025 deadline, so treat the displayed discount as promotional and confirm the actual charge, renewal, taxes, credit behavior, and refund eligibility in checkout. The terms limit the 30-day refund policy to yearly plans.
$0 to start
The site advertises a free signup, but the public homepage does not clearly state the current trial credit allowance.
$9/month promotional ($15 shown as original)
For individual creators, educators, and influencers.
$90/year promotional ($108 shown as original)
The same advertised Lite allowance billed annually.
$18/month promotional ($30 shown as original)
For small and midsize businesses and marketing agencies.
$180/year promotional ($216 shown as original)
The same advertised Pro allowance billed annually.
Pricing checked . Check current pricing at the source ↗
Assessment
Compare
The right alternative depends on the specific output, workflow, controls and budget your project requires.
Content Creator
A text-to-visual alternative for quickly turning concepts and explanations into editable diagrams and graphics.
Explore Napkin AI →Design
A broader design and data-visualization platform for teams that need more manual control over charts, layouts, and presentations.
Explore Visme →Design
A full creative suite with AI assistance, templates, brand kits, and deeper manual editing across many asset types.
Explore Canva AI (Magic Studio) →Consulting
A document and presentation generator for users who want interactive narrative formats in addition to static visuals.
Explore Gamma →Questions
Infography is an AI service that turns a blog post, article, topic, or pasted text into an infographic draft, with templates, brand controls, multilingual support, and optional automation.
Yes. Its current FAQ says users can start from a topic or content even when they do not have a blog post.
The site advertises free signup, but the current public homepage does not clearly state the trial's credit allowance. Confirm the dashboard limit before planning a project.
As reviewed, the live page renders promotional prices of $9 monthly or $90 yearly for Lite and $18 monthly or $180 yearly for Pro. Because stale offer-deadline copy remains on the site, verify the final charge and renewal in checkout.
The current page advertises 50 AI credits per month on Lite and 250 on Pro. The API overview says each API request consumes one credit; the homepage estimates that one credit may yield different numbers of infographics, so measure actual consumption in a trial.
The current Pro offer advertises up to five users. The privacy policy says team administrators may access content created by members, so confirm roles, ownership, offboarding, auditability, and sharing defaults before rollout.
Infography's terms say generated infographics belong to the user and may be used commercially. That promise does not clear rights in uploaded text, data, images, logos, fonts, likenesses, or other third-party material.
The current privacy policy and FAQ name Google's Gemini 2.5 Flash Lite for language-model processing and say the model may change as technology evolves. The public documents do not fully identify every model used in the visual pipeline.
Yes. The REST API is in beta, requires an API key, consumes one credit per request, and is documented for generating infographics from text. Infography warns that features and endpoints may change.
Its automation page describes Make.com workflows that can route generated assets to social platforms. Keep a human approval step; never let an unverified statistic, chart, quotation, or sensitive image publish automatically.
Do not assume so. Compare every label, number, unit, date, quotation, sequence, chart scale, and visual relationship with the approved source. Marketing language about accuracy is not a substitute for a documented evaluation.
Avoid secrets, personal data, confidential business or client content, protected health or financial information, and licensed text or images that cannot be processed by Infography and its providers. The public privacy documentation is not detailed enough to waive a vendor review.
Bottom line
Infography is a practical specialist for turning already-approved written content into branded visual drafts. Its value is speed and repeatability, not factual authority. A sensible pilot compares several real articles, measures credit use and correction time, tests brand and localization quality, and blocks publication until every fact, chart, right, and visual implication has been approved by a person.
Visit Infography website ↗
Get access to all our AI courses, hundreds of real-world AI use cases, live expert-led workshops, an exclusive network of AI early adopters, and more.
Get unlimited access to all of our current & upcoming industry-specific AI courses for the duration of your subscription.
To keep up with the rapid pace of AI, our team publishes AI implementation guides daily. Our library contains 300+ practical use cases to automate real-world work.
Join weekly, live, interactive sessions with industry leaders who are at the forefront of AI for hands-on implementation guidance and exclusive insights.
Network with an exclusive community of AI-first professionals who are working smarter with AI. Learn how early adopters are using AI in their work and businesses.


