Retail and restaurant strategy
Compare store performance, customer overlap, visit trends and market whitespace before prioritizing locations or campaigns.
Independent tool overview
Placer.ai is a location-intelligence platform that estimates visits and audience patterns for stores, properties, chains and geographic markets. Retail, commercial real estate, civic, finance and advertising teams use its dashboard, reports, API and data feeds for site selection, benchmarking, trade-area analysis and market research. The data is aggregated and statistically extrapolated from a mobile-device panel, so it is valuable directional evidence—not a property-level ground truth or a substitute for first-party sales, leases, surveys, fieldwork and professional diligence.
Visit the official Placer.ai site ↗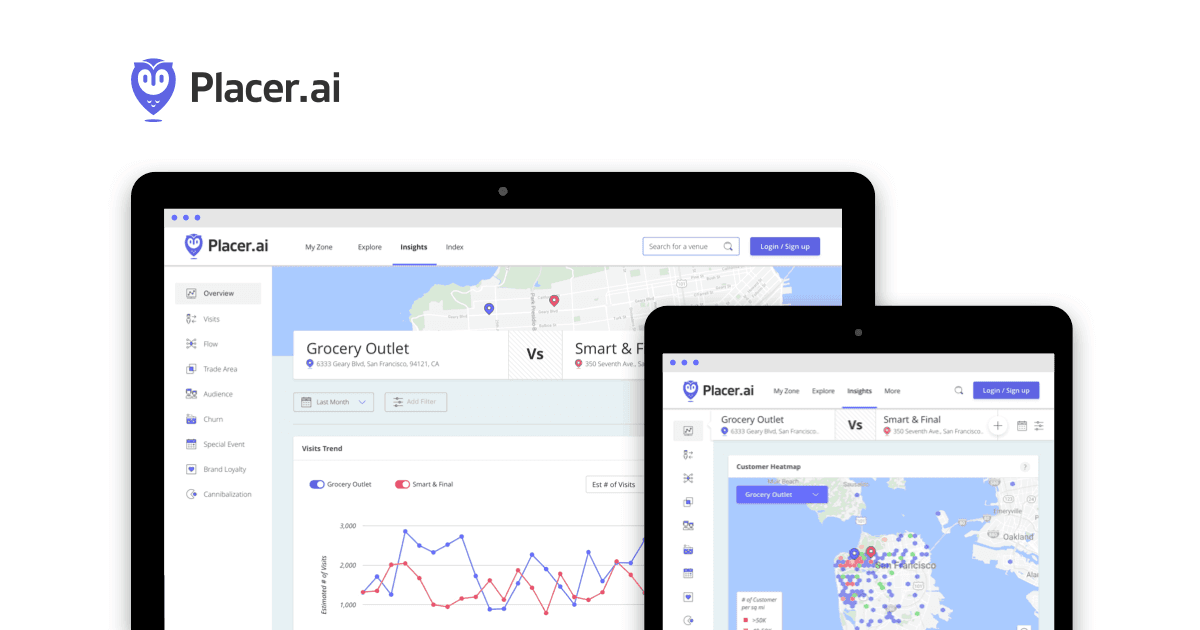
Overview
Placer.ai translates privacy-processed mobile location signals into estimates about physical places. Analysts can compare visitation over time, identify likely trade areas, examine dwell patterns and cross-shopping, benchmark locations or chains and combine those results with demographic and third-party datasets.
Access ranges from a limited free edition to customized subscriptions with unlimited property, chain and industry analysis. Paid data can be used in the interactive platform or integrated into internal workflows through the Placer API and feed products; full pricing is quote-based and the company does not sell one-time reports or offer a trial of the complete suite.
Placer describes its outputs as aggregated statistical estimates. Its documentation defines visitors as extrapolated from unique mobile devices in its panel, while a visit is an estimated entry into a point of interest. Boundary quality, panel representation, privacy thresholds, local context and changes in device behavior can all affect interpretation.
Use cases
The strongest fit depends on the job you need the product to complete, not the size of its feature list.
Compare store performance, customer overlap, visit trends and market whitespace before prioritizing locations or campaigns.
Add visitation, trade-area and competitive context to underwriting, leasing and portfolio monitoring.
Study activity across districts and regions to support economic-development, planning and event-impact work.
Capabilities
Reports estimated visits, unique visitors, frequency, dwell-time and time-of-day patterns for defined physical places.
Maps where a location's likely visitors come from and layers demographic or behavioral attributes onto aggregated origins.
Compares properties, chains, industries and markets on visitation trends, rankings, loyalty and cross-shopping.
Supports screening with nearby activity, market gaps, co-tenancy, cannibalization and local audience context.
Adds datasets such as demographics, sales estimates, planned development, business counts, consumer spending, climate and psychographics.
Lets analysts build property, chain and regional views and export permitted reports under their contract.
Makes aggregated location analytics available for custom dashboards, internal reporting and combination with first-party data.
Process
Step 1
Specify the site, asset, campaign or policy decision, comparison set, time period and threshold that would change the recommendation.
Step 2
Confirm every property polygon, opening or closure date, redevelopment, shared entrance and local event that could distort a comparison.
Step 3
Compare equivalent formats, markets, seasons and operating periods instead of relying on a single headline rank or percentage change.
Step 4
Reconcile Placer trends with first-party transactions, tenant reporting, sensors, surveys, demographic sources, field observations and public records.
Step 5
Present the data window, definitions, known coverage gaps, sensitivity cases and human sign-off before making investment, lending, planning or targeting decisions.
Cost
Placer.ai does not publish a standard full-platform price. Its free edition offers a limited sample of the product, while paid subscriptions are customized. The company says paid subscriptions include a Customer Success Manager and unlimited analysis of properties, chains and industries; API, feed, marketplace, seat and sharing rights should be confirmed in the quote and contract.
Free
A limited view of Placer's platform for basic exploration and educational use.
Contact sales
Ongoing access tailored to the organization and use case.
Custom
Programmatic or automated access for internal systems and large-scale analysis.
Pricing checked . Check current pricing at the source ↗
Assessment
Compare
The right alternative depends on the specific output, workflow, controls and budget your project requires.
Data Analysis
Consider Julius AI when you already own the relevant sales or location dataset and mainly need conversational analysis rather than a proprietary foot-traffic panel.
Explore Julius AI →Data Analysis
Consider Rows for a transparent spreadsheet-based workflow that combines first-party and public data, while recognizing it does not replace Placer's location panel.
Explore Rows →Questions
It estimates visitation and audience patterns for physical places and provides tools for trade-area analysis, benchmarking, site selection, market research and programmatic data access.
Placer offers a limited free edition, but full-platform, API and feed pricing is customized. The company does not publish a standard paid price or offer one-time reports.
It offers a freemium edition, not a trial of the full feature set. Organizations can request a demo and a customized subscription proposal.
Placer says it receives location signals from vetted mobile-data partners after identifiers are removed, aggregates activity around places and extrapolates from its panel to estimate broader visitation.
No. They are statistically extrapolated location estimates. They do not directly prove a purchase, customer identity, revenue or motivation, and they should be checked against first-party and local evidence.
Placer says its partners remove identifiers before data arrives, results are aggregated, maps are approximate and randomized, and the platform does not show data for locations with 50 or fewer unique devices. Customers still need appropriate governance for how aggregate insights are used.
The pricing FAQ says customers may share reports when their contractual terms allow it. Confirm export, attribution, publication, retention and onward-sharing rights in the specific agreement.
Bottom line
Placer.ai is most valuable when a team repeatedly evaluates physical locations and needs consistent, scalable market evidence across many sites. Its platform can reveal useful comparative patterns that are hard to see in isolated transaction files, but the modeled nature of the data is fundamental—not a footnote. Validate boundaries and estimates against first-party and on-the-ground evidence, document uncertainty and never let one visitation metric carry a high-stakes property or public decision by itself.
Visit Placer.ai website ↗
Get access to all our AI courses, hundreds of real-world AI use cases, live expert-led workshops, an exclusive network of AI early adopters, and more.
Get unlimited access to all of our current & upcoming industry-specific AI courses for the duration of your subscription.
To keep up with the rapid pace of AI, our team publishes AI implementation guides daily. Our library contains 300+ practical use cases to automate real-world work.
Join weekly, live, interactive sessions with industry leaders who are at the forefront of AI for hands-on implementation guidance and exclusive insights.
Network with an exclusive community of AI-first professionals who are working smarter with AI. Learn how early adopters are using AI in their work and businesses.