Harvard study puts emissions from 403 U.S. data centers near Denmark’s
Harvard estimates 403 U.S. data centers consumed 82 TWh in a year, while gaps in public energy data make their carbon footprint harder to assess.
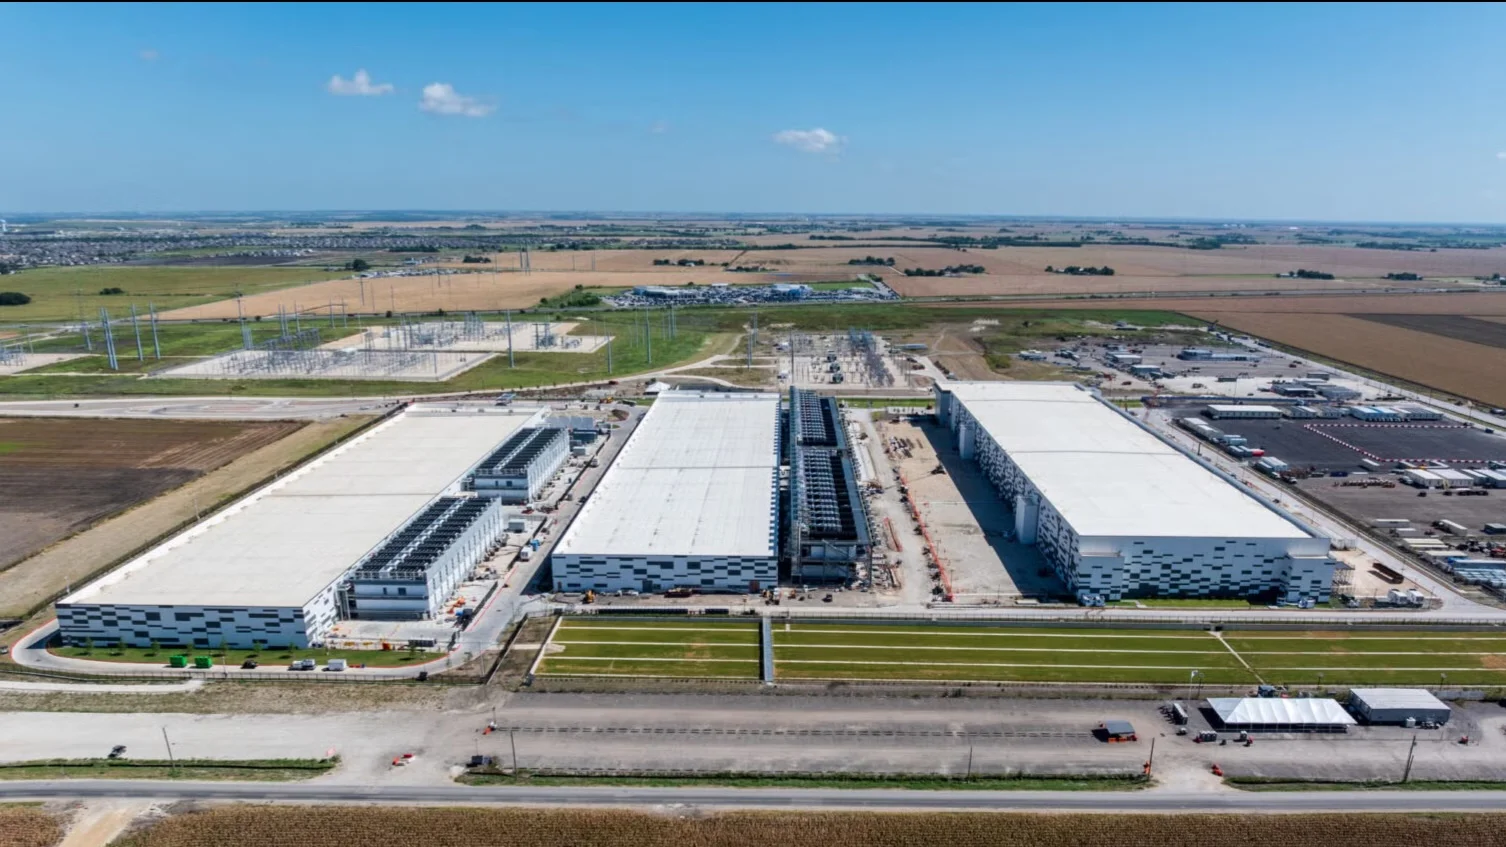
Harvard researchers estimate that 403 U.S. hyperscale data centers consumed about 82 terawatt hours (TWh) of electricity and accounted for 25.7 million metric tons of CO₂ over a year. Harvard compares that footprint with Denmark’s annual emissions.
The Nature Sustainability study, published Nov. 16, 2026, covers May 2024 through April 2025. As The Rundown reported on Nov. 17, limited public energy data forced researchers to reconstruct demand from commercial records and satellite imagery.
What the study found
The central estimate amounts to about 1.8% of U.S. electricity consumption. Fossil fuels supplied roughly 54% of the generation attributed to the facilities, mainly natural gas and coal. Virginia, Oregon, Ohio and Iowa accounted for more than half of estimated electricity consumption.
Researchers started with 675 facilities listed in the commercial database Baxtel, checked locations and building footprints with maps and satellite or aerial imagery, and retained 403. They estimated annual consumption from capacity and assumed operating loads, then applied 2023 EPA grid data to estimate associated emissions.
Different operating assumptions produced estimates of 68 to 99 TWh and 21 to 31 million metric tons of CO₂. Those emissions are modeled from electricity generation. The peer review record flags the lack of validation against metered electricity demand.
The sample covers only part of the U.S. hyperscale fleet, and the data cannot separate AI computing from other work.
Why it matters
About a quarter of the studied electricity demand came from grids dirtier than the U.S. average, according to Harvard. Across the full sample, each kilowatt hour of electricity accounted for an average of 314 grams of CO₂, below the U.S. average of 348.
The state estimates put Oregon at about 11.1 TWh and 1.3 million metric tons of CO₂, compared with Iowa’s 7.2 TWh and 3.2 million metric tons. A smaller power load can carry a larger carbon footprint. Local officials and utilities reviewing a project need to consider both expected demand and the grid that would supply it.
Pollution can also reach people far from the campus. Corresponding author Francesca Dominici identifies particulate matter, nitrogen oxides and sulfur dioxide from fossil fuel generators as concerns for nearby and downwind populations. Assessing those risks means examining where electricity is generated and which communities the pollution could reach. The study did not measure resulting illnesses or deaths.
The model applies annual regional generation averages, which do not trace individual power plants or contracts to facilities. Its fossil fuel share alone cannot disprove an operator’s renewable purchasing claims. Evaluating those claims calls for evidence about both energy purchases and the physical supply of electricity. Estimating the added emissions from a proposed center also requires identifying which generators would respond to the new demand.
Limited disclosure makes that scrutiny harder. Researchers describe very little public energy data for individual facilities. Commercial records helped fill the gap, but the paper’s data statement says facility identifiers, coordinates and commercially sensitive attributes remain restricted by an agreement. Code and regional totals are public. Standardized reporting of measured electricity consumption at each facility would help researchers test their assumptions and give communities a clearer basis for assessing demand on their grids.
Sources & further reading
- 01therundown.ai ↗
- 02hsph.harvard.edu ↗
- 03Assessing the carbon emissions and energy consumption of US hyperscale data centres | Nature Sustainability ↗
- 04Assessing the carbon emissions and energy consumption of US hyperscale data centres ↗
- 05static-content.springer.com ↗
- 06Assessing the Carbon Emissions and Energy Consumption of U.S. Hyperscale Data Centers ↗
This story builds on reporting from The Rundown newsletter on November 17, 2026.